| TerraWorld : Geospatial Data Integration | ||||
| Much of the work on information integration has focused on the dynamic integration of structured data sources, such as databases or XML data. With the more complex geospatial data types, such as imagery, maps, and vector data, researchers have focused on the integration of specific types of information, such as placing points or vectors on maps, but much of this integration is only partially automated. With the huge amount of geospatial data now available and the enormous amount of data available on the Web, there is a terrific opportunity to exploit the integration of online sources with geospatial sources for knowledge discovery. The challenge is that the dynamic integration of online data and geospatial data is beyond the state of the art of existing integration systems. | ||||
 |
||||
| There are two general challenges that must be addressed in order to fully exploit the combination of these different types of sources. First, automated techniques are needed to integrate the diverse source types. For example, integrating maps with imagery or online schedules with road or rail vectors are needed in order to mine the information available by integrating these source types. Second, given the ability to integrate these diverse types of sources, general integration and visualization frameworks are needed to rapidly assemble these sources to support knowledge discovery. For example, one might want a mediator that can support ad hoc queries that require dynamically integrating geospatial and online data sources. Or one might want a more specialized integration framework that supports the integration of specific types of sources to support a given knowledge discovery task. | ||||
| Integration of Online and Geospatial Data | ||||
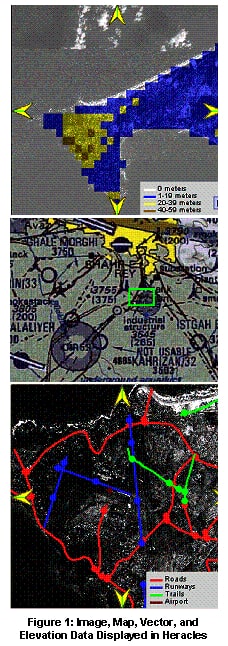
| We have also developed an application of Heracles(Knoblock et al. 2001), that extracts and organizes a wide variety of information into a single, easy-to-access package. Heracles combines information from disparate data sources and displays it in a single integrated framework. The application of Heracles is called the WorldInfo Assistant and it combines a variety of online data about countries: news, weather, airports, economic, and political information, imagery, and maps. This application exploits a wide variety of geospatial data, including image, map, vector, point, and elevation data. On our own servers we maintain roughly 2 terabytes of geospatial data that covers most of the world. Figure 1 shows example map, vector, and elevation data. The focus of the WorldInfo Assistant is on access to different types of information in a single, integrated interface. | ||||
| Integrating Vector Data and Imagery | ||||
| In recent work (Chen et al. 2003), we focused on the problem of accurately integrating geospatial vector data with (satellite or aerial) images. One application for such integration could be for the purpose of automatic recognition and annotation of spatial objects in imagery. We utilized a wide variety of geospatial and textual data available on the Internet in order to efficiently and accurately identify objects in the satellite imagery. To demonstrate the utility of our technique, we built an application that utilizes the satellite imagery from the Microsoft TerraService and the Tigerline vector files from US Census Bureau (as well as some online sources) to annotate buildings on the imagery. | ||||
| The main challenge is that geospatial data (specifically, vector and image data) obtained from various data sources may have different projections, different accuracy levels, and different inconsistencies. The applications that integrate information from various geospatial data sources must be able to overcome these inconsistencies accurately, in real-time and for large regions. Traditionally, this problem has been in the domain of the image processing and GIS systems. However, the conflation approach (Saalfeld 1993) used in various GIS systems to manually or semi-automatically align two geo-spatial data sets does not scale up to large regions. Image processing techniques to identify objects in the image in order to resolve vector-image inconsistencies require significant CPU time and may result in inaccurate results. | ||||
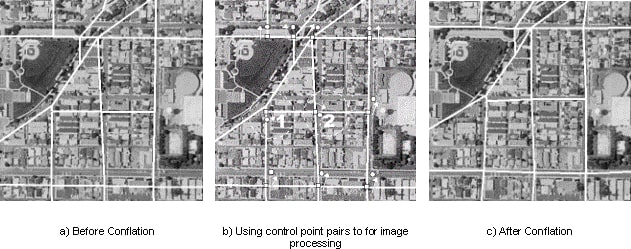 Figure 2. |
||||
| To explain our approach, we first need to explain the conflation process. The conflation process divides into following tasks: (1) find a set of conjugate point pairs, termed "control point pairs", in both vector and image datasets, (2) filter control point pairs, and (3) utilize algorithms, such as triangulation and rubber-sheeting, to align the rest of the points and lines in two datasets using the control point pairs. Traditionally, human input has been essential to find control point pairs and/or filter control points. Instead, we developed completely automatic techniques to find control point pairs in both datasets and designed novel filtering techniques to remove inaccurate control points. | ||||
| We developed two different techniques to find accurate control point pairs. Our first technique generates control points using localized image processing. The second technique finds control points by querying information from online web sources. We briefly describe the first technique, which relies only on the imagery and vector data for accurate integration. We find feature points, such as the road intersection points, from the vector dataset. For each intersection point, we perform image processing in a small area around the intersection point to find the corresponding point in the satellite image. The running time for this approach is dramatically lower than traditional image processing techniques due to localized image processing. Furthermore, the road directions information makes detecting edges in the image much easier problem, thus reducing the running time even more. | ||||
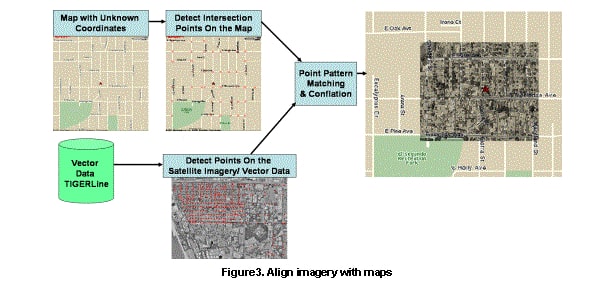 Figure 3. |
||||
| Integrating Maps and Imagery | ||||
| In a follow-up study (Chen et al. 2004) to our automatic vector to image conflation, we developed efficient techniques to the even more challenging problem of automatically conflating maps with satellite imagery. There is a wide variety of geo-spatial data available on the Internet that provides satellite imagery and maps of various regions. The National Map, MapQuest, University of Texas Map Library, Microsoft TerraService, and Space Imaging are good examples of map or satellite imagery repositories. In addition, a wide variety of maps are available from various government agencies, such as property survey maps and maps of oil and natural gas fields. Satellite imagery and aerial photography have been utilized to enhance real estate listings, various military targeting applications, and other applications. | ||||
| Through its language and execution system, Theseus enables agents to perform useful information management tasks, such as periodic execution, query result accumulation, and flexible result communication. Most importantly, through properties of its architecture, Theseus reduces the overall effect of network latencies on data integration, providing increased parallelism and asynchrony during execution so that the overall end-to-end agent execution process is substantially faster. | ||||
| Integrating Maps and Imagery | ||||
| In a follow-up study (Chen et al. 2004) to our automatic vector to image conflation, we developed efficient techniques to the even more challenging problem of automatically conflating maps with satellite imagery. There is a wide variety of geo-spatial data available on the Internet that provides satellite imagery and maps of various regions. The National Map, MapQuest, University of Texas Map Library, Microsoft TerraService, and Space Imaging are good examples of map or satellite imagery repositories. In addition, a wide variety of maps are available from various government agencies, such as property survey maps and maps of oil and natural gas fields. Satellite imagery and aerial photography have been utilized to enhance real estate listings, various military targeting applications, and other applications. | ||||
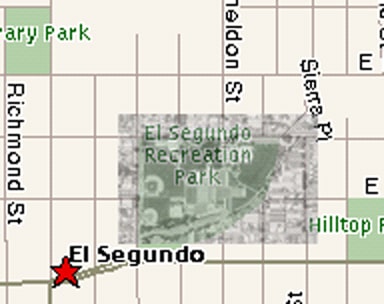 Figure 4. |
||||
| By integrating these spatial datasets, one can support a rich set of knowledge discovery queries that could not have been answered given any of these datasets in isolation. For example, when you are looking for a park in a neighborhood, the satellite imagery may provide you better view of the park, while the map is essential to see the surrounding streets and how to get to the park. However, accurately integrating maps and imagery from different data sources remains a challenging task. This is because spatial data obtained from various data sources may have different projections and different accuracy levels. If the geographic projections of these datasets are known, then they can be converted to the same geographic projections. However, the geographic projection for a wide variety of geo-spatial data available on the Internet is not known. The fact that many of the online maps sources do not provide the geo-coordinates of the maps makes the integration even more complicated. | ||||
| An overview of our approach is illustrated in Figure 3. Basically, we use common vector datasets as "glue" to integrate imagery with maps and the geo-coordinates of the maps are unknown in advance. In particular, our approach utilizes the road intersection points automatically identified on imagery and maps (Chiang et al. 2005) and applies a specialized point matching algorithm to compute the alignment between the two point sets. Experimental results on the city of El Segundo demonstrate that our approach lead to remarkably accurate alignments of maps and satellite imagery. The aligned map and satellite imagery can then be used to make inferences that could not have been made from the map or imagery alone. Figure 4 show an example of our results on the city of El Segundo. | ||||
| Integrating Online Schedules (Moving Objects) with Vectors | ||||
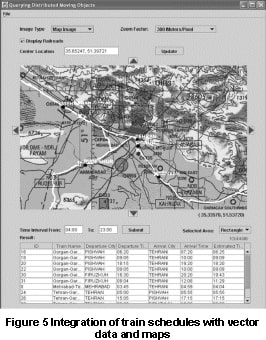 Figure 5. |
||||
| In our prior work (Shahabi et al. 2001), we investigated challenges in efficient support of queries on moving objects (e.g., trains and cars). Here, we discuss one of the query types, which focuses on the integration of online schedules with vectors. This is an example of the integration of temporal data (train schedules) with spatial data (train tracks and stations) and how the combination allows answering questions which could have not been answered on the sources individually. | ||||
| In (Shahabi et al. 2001), we show how a temporal source, e.g., a website providing train schedule information, can be integrated efficiently with a spatial source that contains railroad vector data. In particular, we study efficient execution of spatio-temporal range queries on the integrated sources. A spatio-temporal range query imposes bounds on spatial and temporal attributes and asks for all tuples satisfying the constraints. For example, given a geographical area (e.g., bounded by a rectangle) and a time interval, we would like to find all the trains that would be in that area in the given time-interval. The GUI of this application is shown in Figure 5. | ||||
| Automatic Extraction of Road Intersections from Raster Maps | ||||
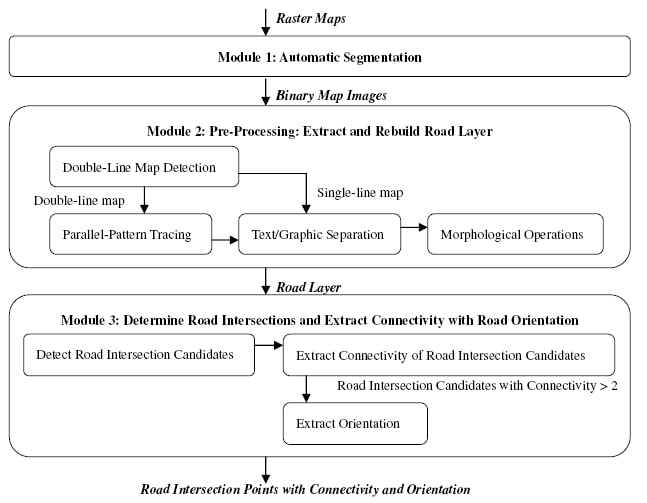 Figure 6. |
||||
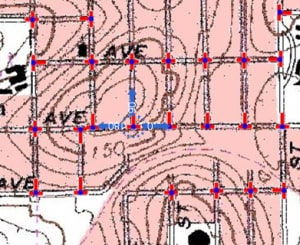 Figure 7.The position of road intersections, the intersection connectivity and the road orientations. (USGS Topographic Map, El Segundo, CA USA) |
||||
| In previous work (Chen et al. 2004), we developed a simple approach to detect intersections from simpler raster maps, and we only used the positions of the road intersection points in the matching process during the conflation. Here (Chiang et al. 2005), we present a more general approach to handle diverse and more complicated maps (e.g., USGS Topographic Maps, Thomas Brother Maps). | ||||
| The overall approach is shown in Figure 6. The input of our approach can be any raster map regardless of resolution from various sources and without any prior knowledge such as color of layers, vector data, legend types or gazetteer data. The outputs are the positions of road intersection points as well as the connectivity and the orientation of each intersected road. | ||||
| Raster maps usually contain many objects, such as characters, buildings, streets, rivers or even contour lines in topographic maps, and it is important that we can distinguish between these objects and the background. | ||||
| We use the differences in luminosity level to remove background pixels in the first module, and use the geometry properties of road lines to separate road layers from others among foreground pixels in the second module. The last module detects salient points and determines which salient points should be identified as road intersection points by counting the connectivity of each salient point along with the orientation of each intersected road. | ||||
| We achieve higher precision/recall than the previous work. We also effectively compute the intersection connectivity and the road orientations to help a conflation system to prune the search space during the matching process as shown in Figure 7. | ||||
| A Geospatial Mediator | ||||
| Using the capabilities described above for integrating the various geospatial data types, we are now working on the problem of how to build a general mediator for dynamically integrating the online data sources with the various geospatial products available. The resulting system will support ad hoc queries over the huge amount of online and geospatial data sources to support applications such as knowledge discovery or real-time emergency response. | ||||
| A Geospatial Mediator | ||||
| The ability to reason over geospatial entities using publicly available information is greatly enhanced by the abundance of geospatial data sources on the Internet. Traditional data sources such as satellite imagery, maps, gazetteers and vector data have long been used in geographic information systems (GIS). However, incorporating non-traditional sources such as phone books and property tax sites brings to light integration issues that have not previously been dealt with. For example, it is not clear how phone book information (i.e. street name and building number) could be combined with road vector data to label buildings found in a satellite image. | ||||
| However, combining traditional and non-traditional data sources provides the ability to verify the accuracy of geospatial databases such as gazetteers and augment these gazetteers with additional information brought in from non-traditional data sources. For example, we can imagine a scenario where different data sources are used to populate a geospatial database for a given area. Data can be retrieved and integrated from multiple sources, both traditional and non-traditional. The resulting integrated data can be stored in a standard format, such as the Gazetteer Content Standard proposed by the Alexandria Digital Library (ADL) or the Web Gazetteer service (WFS-G) Standard proposed by OpenGIS and made available to the public. If this process could be automated, the creation and maintenance of public gazetteers would become much easier. | ||||
| Our approach uses a constraint satisfaction problem (CSP) approach for assigning labels (street name and address) to buildings in a given satellite image. The general framework of the system can be seen in Figure 8. It is comprised of three main components; a set of publicly available information sources, the CSP model, and the CSP solver. The intuition behind this framework is as follows: begin by gathering all of the publicly available data, such as satellite imagery, vector data, and a phone book. Then incorporate this data into a CSP model that is created using the CSP formulation explained below. After creating a new problem instance, the CSP model is passed to the CSP solver. The CSP solver returns all of the possible solutions to the problem. Finally merge the solutions to create a set of possible street and address assignments for each building and return this set as the final solution. | ||||
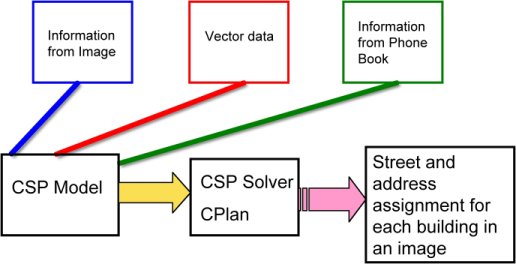 Figure 8. |
||||
| The approach we present is a novel way to use both explicit and implicit information in publicly available data sources. The key challenge lies in combining this information and using it to label buildings in satellite imagery with a high degree of accuracy. Using a constraint satisfaction framework allows us to address the integration issue by generating a CSP model that allows all of the information to be plugged in easily. Finally, leveraging common properties of streets and addresses in the world allows us to provide solutions that could not be deduced from any individual source but require the combination of data from multiple sources. For more details, please consult our AAAI-2005 paper. | ||||